Because of the needs and expectations of my MSc project, I’ve searched a lot for an appropriate data plotter and visualizer for charts and graphs. Some of them are well known to most users, such as Microsoft Excel, MATLAB, and Origin, and some are less known, like SigmaPlot, GraphPad Prism.
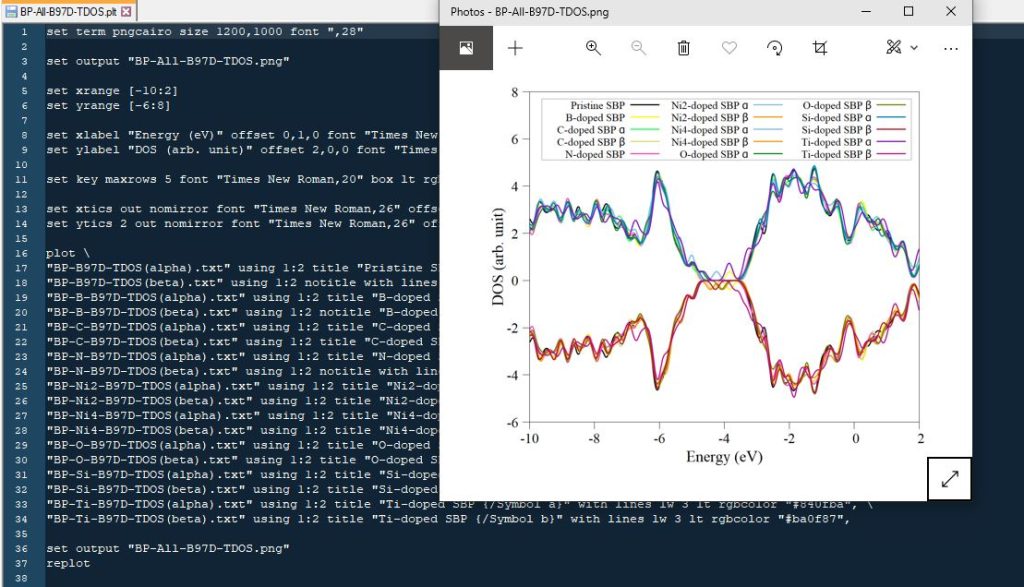
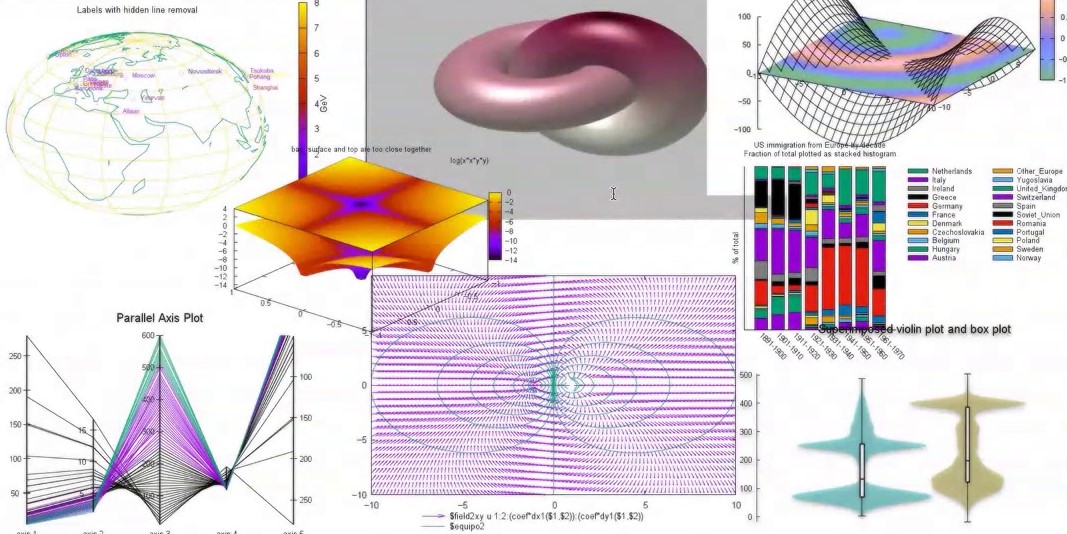
Among available programs, a simple low-size program sparkled, the GNUplot. It’s free and open-source, suitable for scientific use, and if you are familiar with the command line, it is easy indeed. Different libraries could be added to GNUplot for visualizing data in different types in two- or three-dimensional. Since the program has no graphical user interface – it may be considered a weakness -, some programming knowledge is needed for working with the command line where input data, plot or graph type, and other associated properties are set.
One of the best properties of GNUplot is the fast speed of results’ exporting when handling data for an experiment in different conditions, is intended. In this manner, the only important point that must be noticed is setting correct data’s input file names, labels, and legends. After running commands, figures with the same scale and resolution will be generated: an essential issue in scientific articles or thesis templates.